Automate your TNMM analysis. Access global financial data to determine arm's length margins and Profit Level Indicators (PLIs) in minutes. Aligned with OECD standards.
Over 50,000 companies with standardized financial data
Complete transparency of data and calculations
SIC and NAICS code classification for precise industry comparisons
Country and size filters for tailored analyses
Trusted by tax advisors and international companies
Trusted by Tax Professionals and Multinational Groups
Feature
Incorrect Benchmarking Data Trigger Tax Risks.
Tax authorities are tightening their scrutiny, and documentation requirements are stricter than ever. Manual benchmarking is risky and time-consuming. smartZebra provides a standardized, automated process to find comparable companies and determine arm's length ranges, ensuring your documentation stands up to scrutiny.
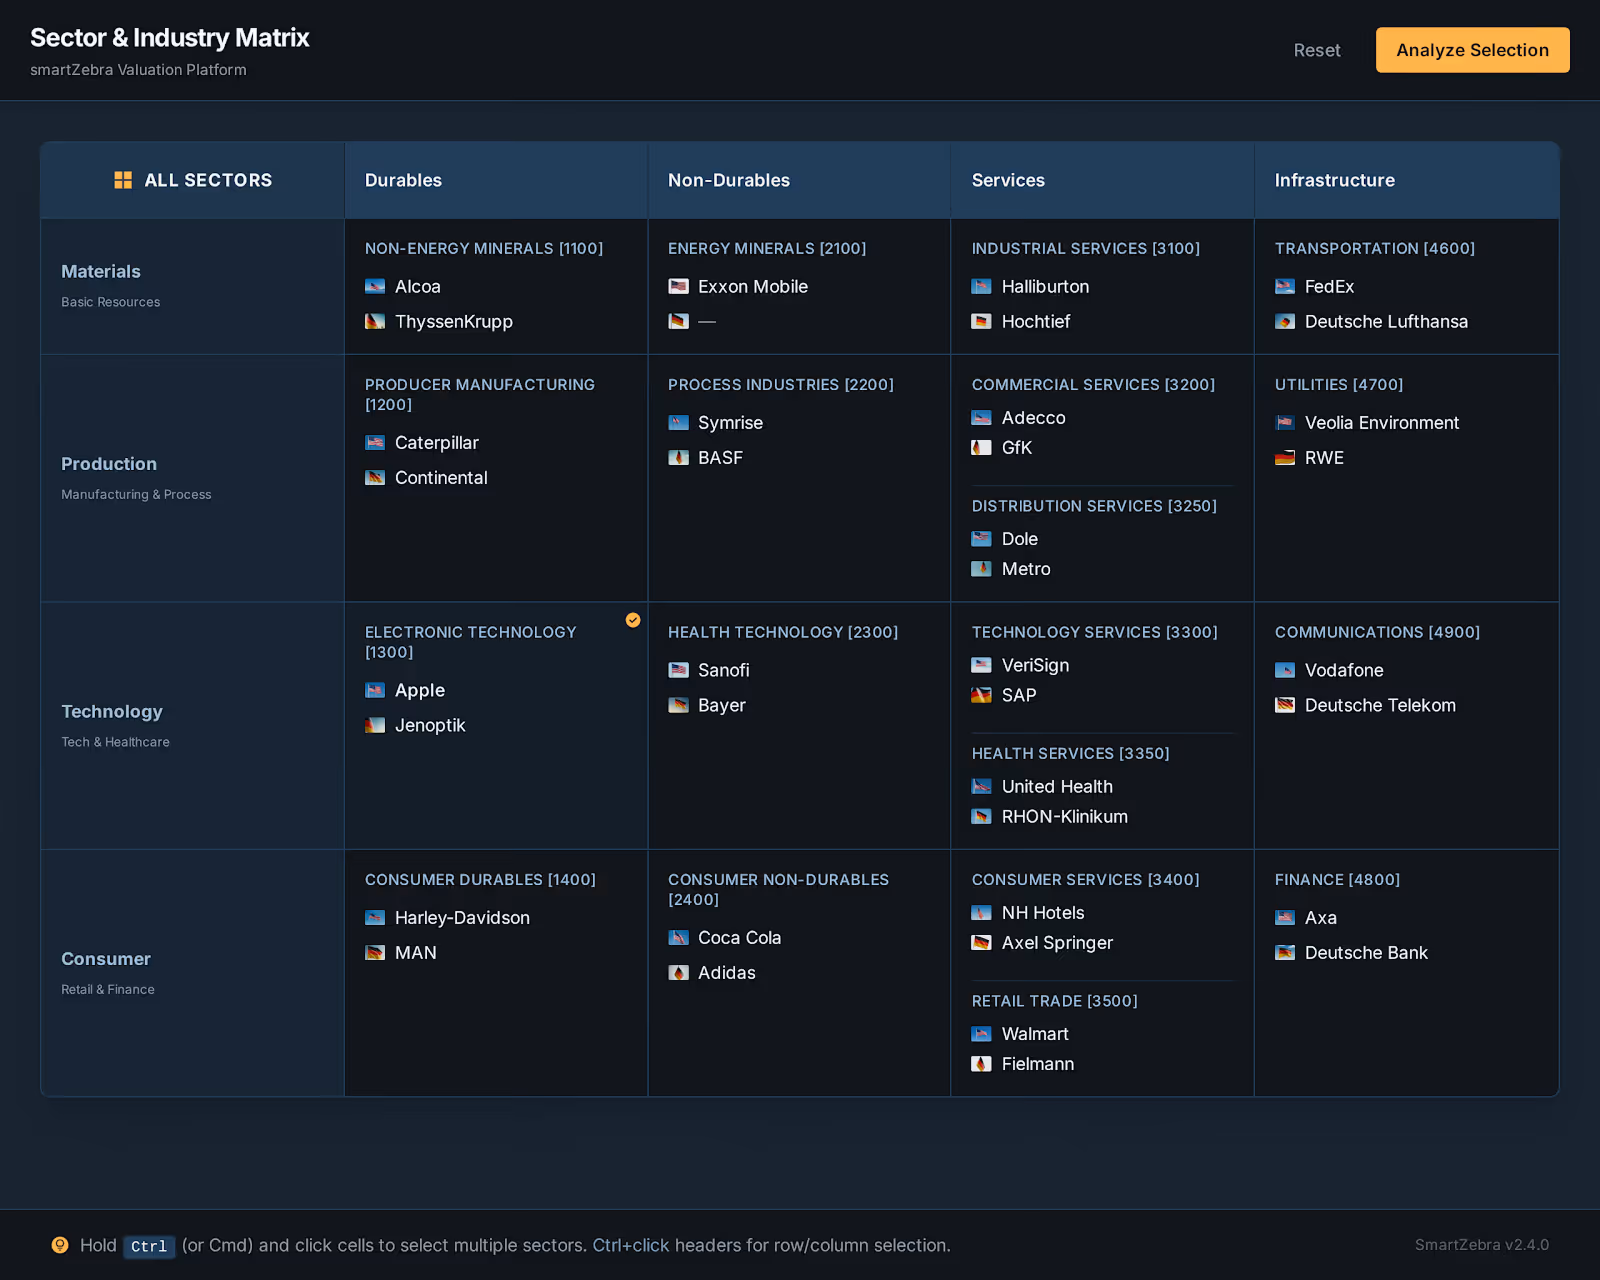
Customizable
Profit Level Indicators (PLIs) with Full Transparency.
All the metrics you need for Transactional Net Margin Method (TNMM) analysis.
Profit Level Indicators
Calculate EBIT Margins, Berry Ratios, and Return on Costs instantly.
Smart Screening
Apply quantitative screens for independence, losses, and R&D intensity.
Private & Public Companies
Access 50,000+ potential comparables across all major tax jurisdictions.
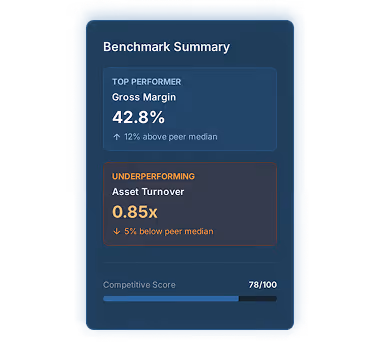
Arm's Length Range
Automatic calculation of the Interquartile Range (IQR) and Median.
Source Links
Direct traceability to the original annual report for every data point.
Benchmark Export
One-click generation of the full benchmarking study appendix.
Action
Streamline Your TP Documentation.
Critical support for your tax compliance lifecycle:
TNMM Benchmarking Studies
Local File Documentation
BEPS
Advance Pricing Agreements (APAs)
Intercompany Service Charges
Tax Risk Assessments
PLIs in Three Steps.
Cash flow refers to the net balance of cash moving into and out of a business. Positive cash flow means more money is coming in than going out, negative cash flow indicates the opposite.